![]()
Biomedical Sciences, Biomed Biopharm Res., 2021; 18(2):191-199
doi: 10.19277/bbr.18.2.264; [+] PDF version here; [+] Portuguese html here
Photopletismography in dogs: identification of spectral elements and application in a surgical setting
Rui Assunção 1,2, Clemente Rocha 3, Luis Lobo 1,2, Luís Monteiro Rodrigues 3, João Requicha 1,4*
1 Faculty of Veterinary Medicine, University Lusófona, Av. Campo Grande 376, 1749-024 Lisboa, Portugal;
2 Hospital Veterinário do Porto, Tv. de Silva Porto 174, 4250-475 Porto, Portugal;
3 CBiOS - Research Center for Biosciences and Health Technologies, University Lusófona, School of Health Sciences & Technologies, Av. Campo Grande 376, 1749-024 Lisboa, Portugal;
4 CECAV - Veterinary and Animal Research Centre and AL4AnimalS, Department of Veterinary Sciences, University of Trás-os-Montes e Alto Douro, Quinta de Prados, 5000-801 Vila Real, Portugal
*corresponding author:
Abstract
This pilot study aimed to assess cardiac and respiratory activity in dogs using photopletismography (PPG) during the presurgical period and to determine the spectral elements composing the measured PPG signal. The studied sample comprised four dogs, two males and two females, ranging from 7 months to 6 years old, from different breeds under anesthetic premedication. PPG signal was obtained at the tail using a PPG sensor connected to a Bitalino hardware board (Plux, Portugal) before and after premedication with 5 µg/kg dexmedetomidine and 0.35 mg/kg methadone by intramuscular injection. The data obtained was analyzed using Matlab (MathWorks, USA) and the PPG signal decomposed into its various frequencies by the Wavelet transform. The estimated minimum and maximum values of heart and respiratory activity were then identified. Seven waves were found. Correspondence with the cardiac and respiratory activities was determined after comparing its frequency with the normal heart and respiratory frequencies in dogs. This study demonstrated that the PPG technique is a valuable diagnostic tool to record both heart and respiratory frequencies in a clinical setting using a wireless system.
Keywords: dog, respiratory rate, heart rate, photoplethysmography, anesthesia, Wavelet transform
Received: 05/08/2021; Accepted: 21/11/2021
Introduction
Wearable technology is already an integrative component of human and life sciences. In dogs, as in many other companion and working animals, wearable monitoring helps to obtain objective measurements in natural home settings, rather than relying on more subjective assessments of owners (1).
Photoplethysmography (PPG) is a non-invasive technique (2) with a wide range of clinical applications, being used in several devices, such as pulse oximeters and blood pressure detection systems (3). The PPG signal reflects changes in blood volume in the cutaneous and subcutaneous vascular plexus (3,4), having a major component associated with heartbeat and respiration and others associated with low frequency influencers (5). Using signal analysis programs, it is possible to investigate the PPG signal and characterize its various constituents at the different frequencies of the PPG signal (3). In this way, the fluctuations associated with the cardiovascular, respiratory, and neuronal systems can be properly characterized and measured within the PPG signal (6). In 2013, Nilsson described the various frequencies found in PPG signals in humans, using the wavelet method to decompose a primary signal into its various elements (7).
In veterinary medicine, as of this writing, there is no data available on the frequency range of the various constituents of the PPG signal in the dog. However, it is possible to assume that the frequencies referring to cardiac and respiratory activities have higher frequency ranges, as in dogs (as reported by Houston in 2000), the heart rate might vary between 60 and 140 beats per minute (bpm), that is, between 1 and 2.3 Hz. Likewise, the respiratory rate might vary between 18 and 36 breaths per minute (rpm), that is, between 0.3 and 0.6 Hz (8).
In the present study, the potential utility of the reflection PPG sensor was investigated in a veterinary surgical setting. Pulse wave data collected before and after the administration of sedative medication was obtained from the tails of dogs and analyzed.
Materials and Methods
This study was approved by the Ethics and Animal Welfare Committee of the Faculty of Veterinary Medicine of Lusófona University (Lisbon).
Four dogs age ranging from 7 months to 6 years old (4 ± 2.8 years), different breeds (Dalmatian, Golden Retriever, Portuguese Retriever, mixed breed), with body weights between 15-29 kg (20 ± 7.8 kg) and from different genders (two males and two females) were studied.
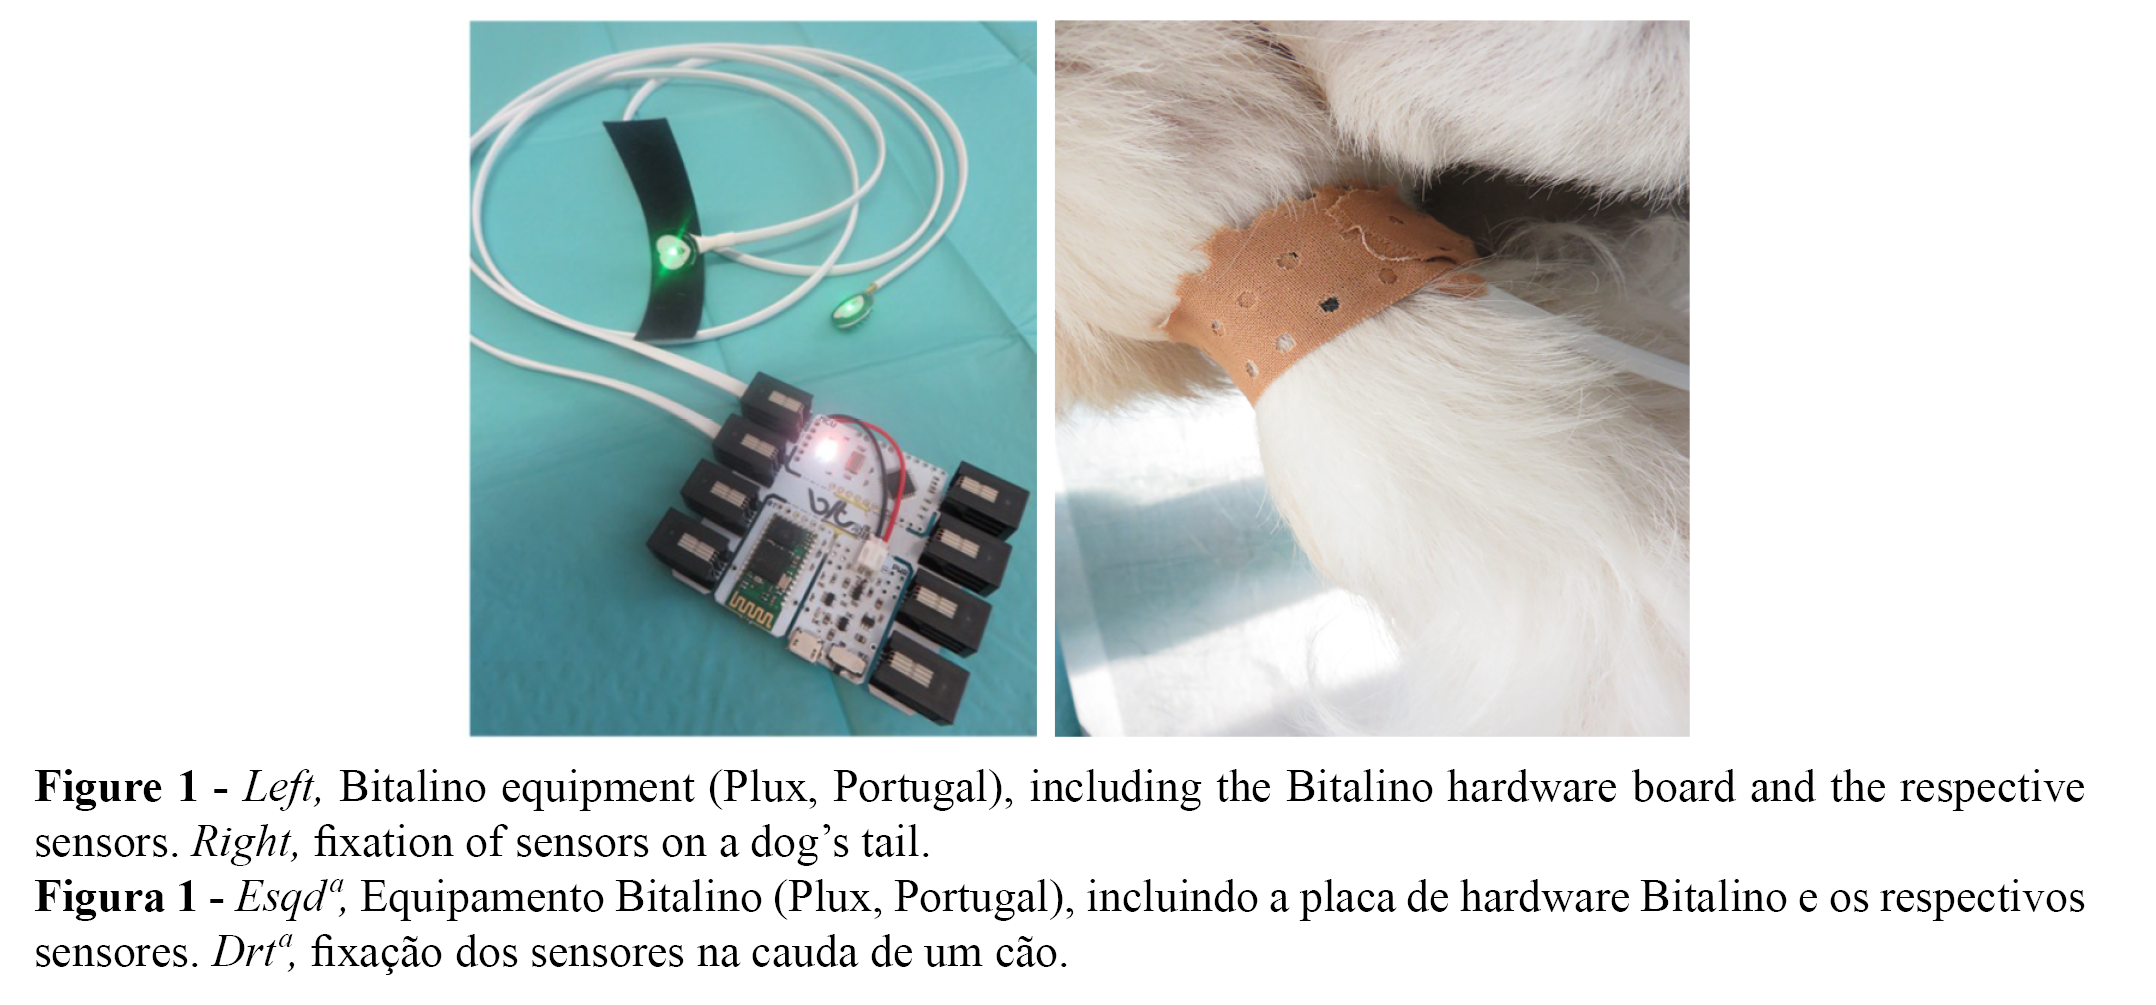
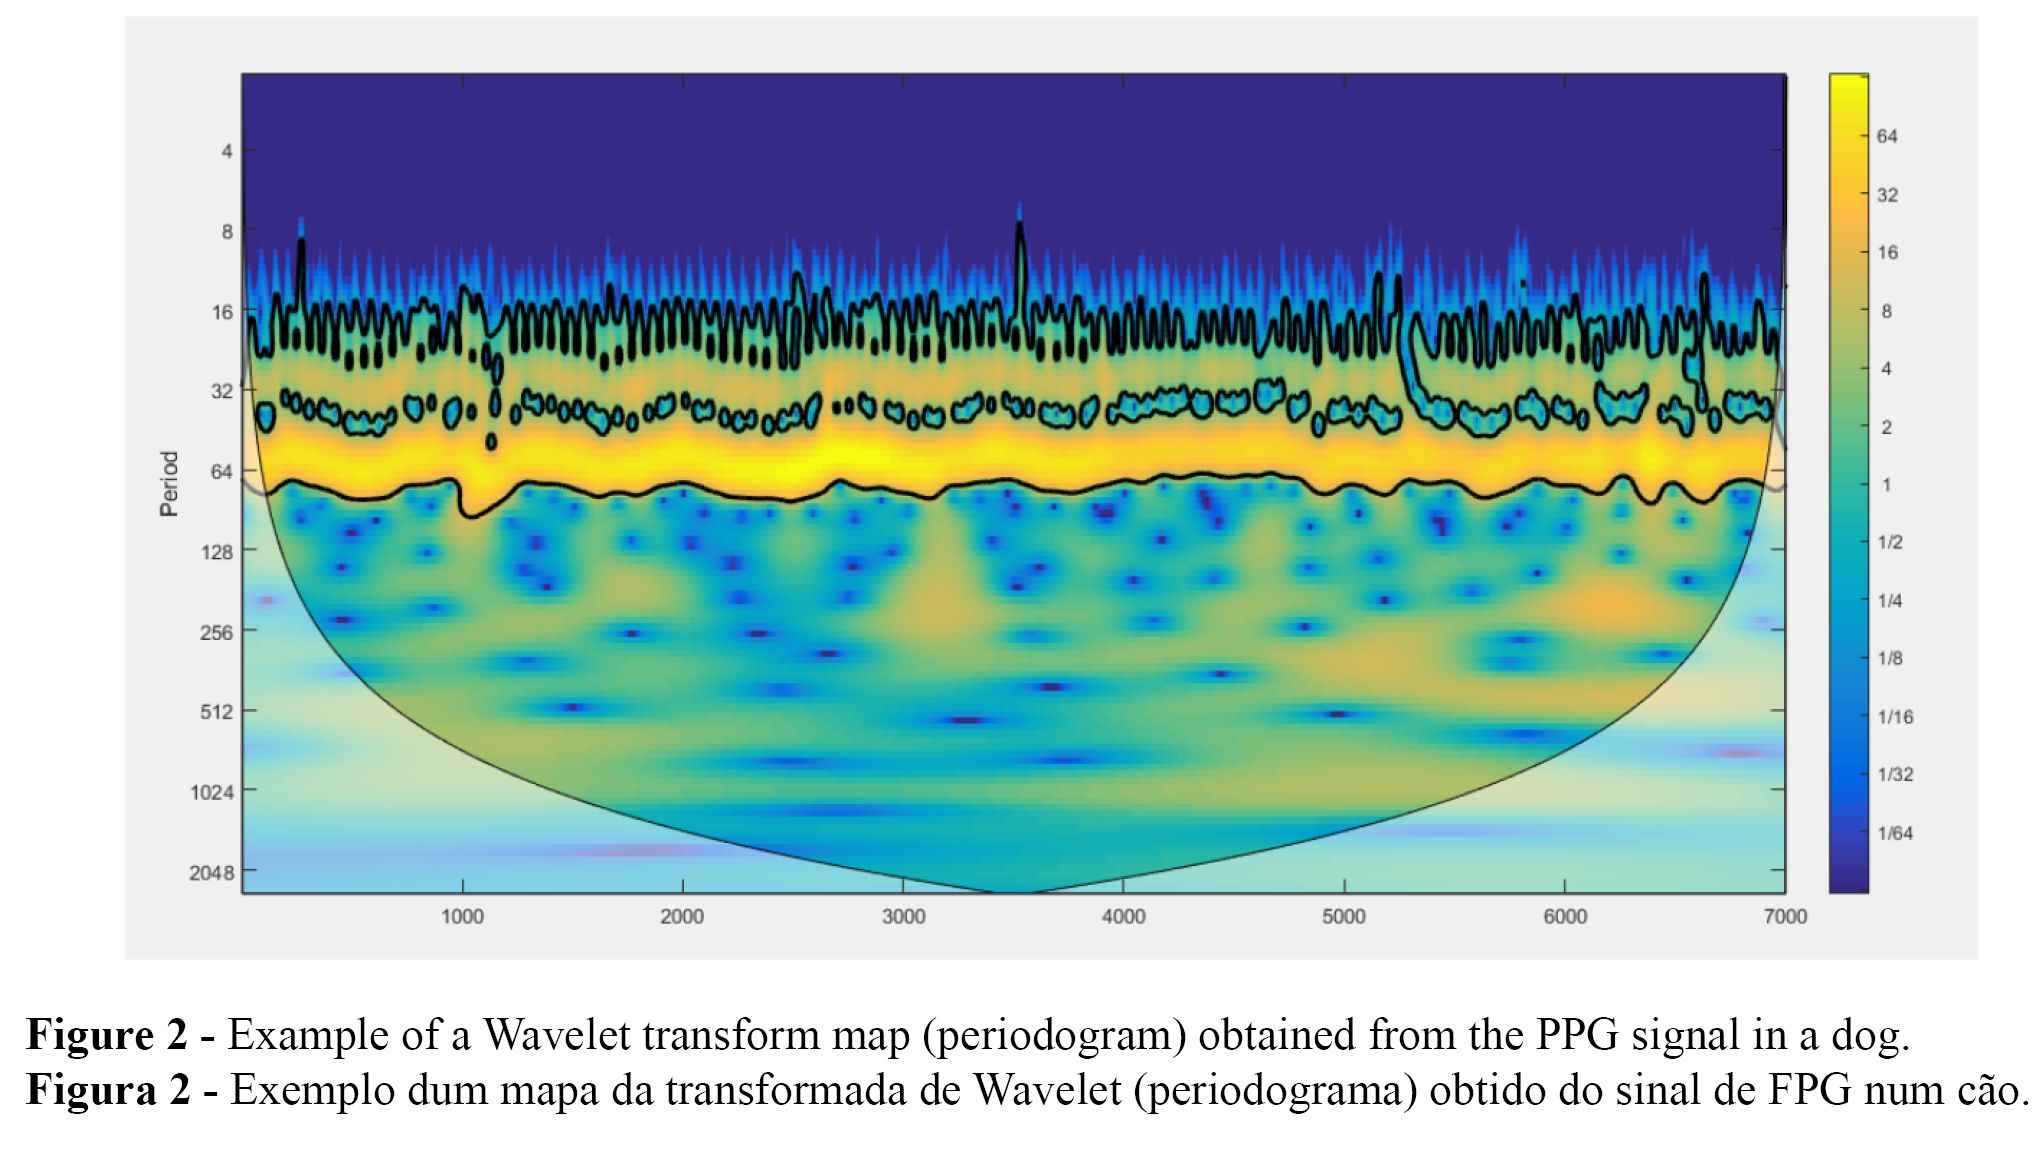
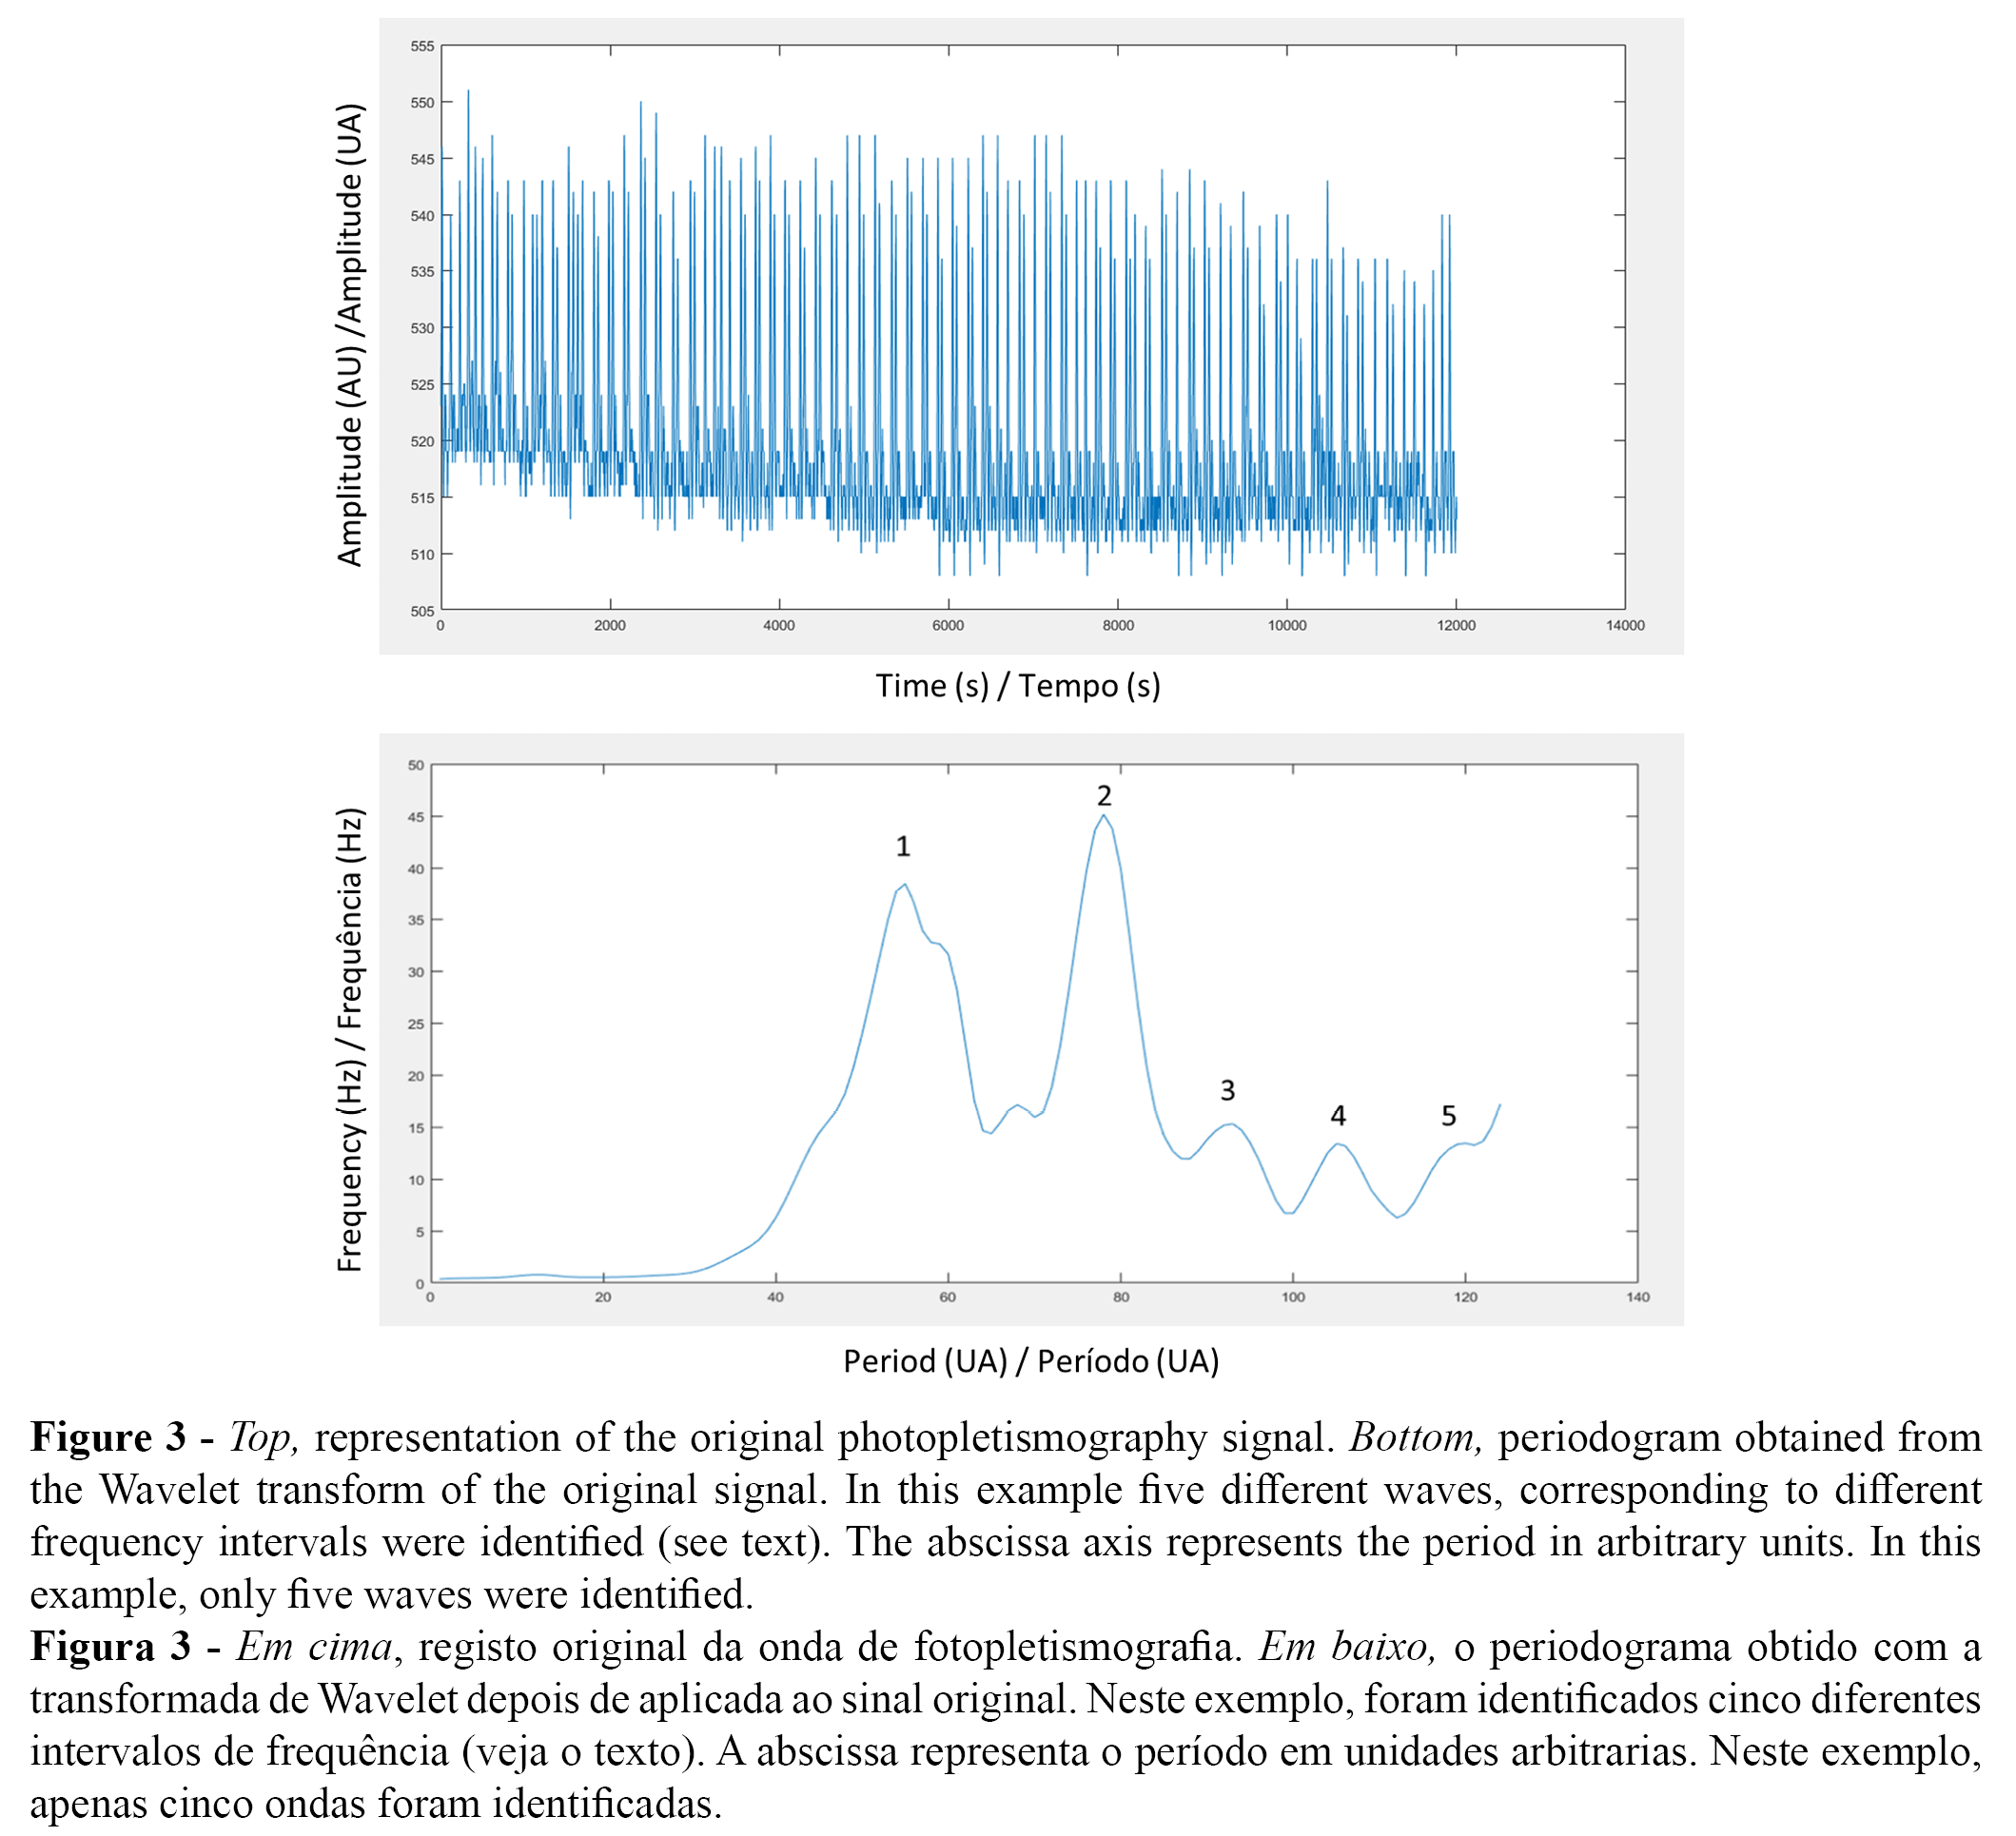
For each dog, we performed a trichotomy of a small area in the ventral part of the tail in order to improve the contact between the sensor and the skin (Figure 1); the choice of the tail as study site was due to ease of access and comfort for the animal. Data collection was carried out for 3 to 5 minutes followed by preanesthetic medication using 0.35 mg/kg methadone (Semfortan, Esteve, Spain) and 5 µg/kg dexmedetomidine (Dextomitor, Zoetis, USA) by intramuscular injection. After a waiting period of between 15 and 30 minutes to ensure the expected (sedative) effect of the medication, the PPG signal was collected again in the same anatomical region. The data was obtained with a PPG sensor connected to a Bitalino hardware (Plux, Portugal) (Figure 1), and later downloaded to the OpenSignals (r)evolution software (beta version v.2015) of Bitalino. Finally, data was analyzed using the MatLab software (MathWorks Inc, v. R2016a, USA) after selecting the column of obtained values and following the visualization of the corresponding pulse wave (Figures 2 and 3).


After selecting the data to be analyzed, the code 1 (see Appendix, taken from http://noc.ac.uk/using-science/crosswavelet-wavelet-coherence) was applied, which identified the maximum amplitude peaks for each wave. The next step was to create an artificial sine signal to obtain an expression of conversion of periods into frequency. Thus, a sine equation with known frequencies was created in code 2 (line b). Later a trend line was created and translated by the following equation y= 49.416e-0.057x; R² = 0.9999.
After the creation of the artificial sine signal, the Wavelet transform for the PPG signal was calculated. Using code 3, the Wavelet transform decomposes the signal into a periodogram resuming all different frequency components (Figure 2). With the minimum and maximum period of each wave obtained in the periodogram, we were able to obtain, minimum and maximum frequencies for each wave using the described equation. Replacing the value of x in the equation with the period value and then multiplying by 60, we obtained the activity value per minute of each wave in the periodogram.
The protocols mentioned above were applied to each animal in all records obtained before and after administration of medication.
Results
Figure 3 shows an original PPG signal and the respective decomposition by the Wavelet transform analysis.
The maximum and minimum frequencies of each wave of the different animals analyzed before medication were, respectively: wave 1 - 3.11 and 9.43 Hz; wave 2 - 1.18 and 3.00 Hz; wave 3 - 0.57 and 0.97 Hz; wave 4 - 0.23 and 0.44 Hz; wave 5 - 0.12 and 0.21 Hz; wave 6 (registered only in three animals) - 0.09 and 0.14 Hz and wave 7 (registered only in two animals) - 0.04 and 0.09 Hz. The PPG wave-frequencies obtained after administration of medication were: wave 1 -between 1 - 2.04 and 7.55 Hz; wave 2 - 0.86 and 2.04 Hz; wave 3 - 0.28 and 0.71 Hz; wave 4 - 0.12 and 0.26 Hz; wave 5 - 0.07 and 0.12 Hz and wave 6 (only one animal) between -0.08 and 0.10 Hz.
Discussion
This study illustrated, for the first time, the use of PPG as a monitoring technology for heart and respiratory rates in dogs in a surgical setting in veterinary medical practice, as well as the characterization of the different frequency waveforms present in the PPG signal.
Seven frequency waves were identified in these signals. Based on previous reports conducted in humans, rats and mice (6,9), taking also into account the normal heart and respiratory rates in dogs, we assumed that the different frequency waveforms were related to (in descending order of frequency averages): (i) the harmonic of cardiac activity (1st wave, between 3.11 and 9.43 Hz), (ii) cardiac activity (2nd wave, between 1.18 and 3.00 Hz), (iii) respiratory activity (3rd and 4th waves, between 0.57 and 0.97 Hz and 0.23 and 0.44 Hz, respectively), (iv) afferent vagal activity (5th and 6th waves, between 0.12 and 0.21 Hz and 0.09 and 0.14 Hz, respectively) and (v) to sympathetic tone groundings (7th wave, between 0.04 and 0.09 Hz).
After the administration of the sedative medication, a decrease in the values for cardiac and respiratory activity and a decrease in the mean frequency of each wave were clear within the PPG signal. In medical practice, the utility of PPG in determining cardiac and respiratory rates are widely recognized (7,10). In veterinary medicine, as far as our current knowledge goes, only one study has associated PPG with respiratory rate (11). Differences found regarding respiratory activity before and after administration of medication were not statistically significant, although a slight decrease in maximum respiratory activity and a (larger) decrease in minimum respiratory activity were detected. However, the purpose of this exploratory study was to test the applicability of this technology in the present setting, and in our opinion this goal was achieved.
We recognize the limitations involved in our study, including the small dimension of the sample used, the inter-individual variability, and the difficulty in selecting the ideal anatomical site for placing the sensor. Clearly, additional prospective animal studies are needed to validate the PPG technique in the present setting. Nevertheless, taking into account these results and our experience, for future studies we foresee (i) to include to a larger and more homogeneous population in terms of breed, age or live weight of the animals, in a way to reduce experimental bias, (ii) to use different anatomical sites, such as the ear or the extremities of the thoracic and pelvic limbs, (iii) to increase the duration of data collection to limit associated with animal movement and (iv) to conduct a comparative study of heart rate and respiratory rate obtained using other referenced techniques / methods in addition to PPG.
This study demonstrated the potential utility of such a wearable instrument in the clinical environment. The possibility of obtain biometrical data rapidly and easily, including cardiac and respiratory rates, from the photoplethysmography signal can help, in a simple way, to manage several conditions where the monitoring of these parameters gains a crucial importance to manage animals with chronic cardiopulmonary conditions, geriatric patients and convalescence animals upon surgery.
Conclusion
This pilot study demonstrated the relevance of reflection PPG, a non-invasive technique, to measure the heart and respiratory rates in dogs, and its utility in the clinical and ambulatory environment in veterinary medicine. It was also possible to confirm that the tail seems to be an appropriate anatomical area in dogs to collect these parameters.
Authors Contributions Statement
JR, LMR, conceptualization and study design; RA, LL experimental; RA, CR, data curation; RA, JR, LMR, drafting, editing and reviewing; JR, LMR, supervision and final writing.
Acknowledgements
This work was funded by national funds through FCT - Foundation for Science and Technology, I.P., under the Scientific Employment Stimulus - Institutional Call - CEECINS/00127/2018 and supported by the project UIDB/CVT/00772/2020 and associated laboratory AL4AnimalS.
Conflict of Interests
Editors involved in this manuscripts’ authorship had no participation in the review or decision process. All authors have stated that there are no financial and/or personal relationships that could represent a potential conflict of interest..
Appendix
Code 1
(http://noc.ac.uk/using-science/crosswavelet-wavelet-coherence)
a. t=1:length(ppg);
b. figure(1);
c. plot(t,ppg)
d. title('Raw Signal')
e. xlabel('Samples');
f. ylabel('Voltage(mV)')
g. legend('Noisy PPG Signal')
h. grid on
i. %Find Peaks
j. [~,locs_Peak] = findpeaks(ppg,'MinPeakHeight',a,...'MinPeakDistance',b);
k. figure(3)
l. hold on
m. plot(t,ppg);
n. plot(locs_Peak,ppg(locs_Peak2),'rv','MarkerFaceColor','r');
o. axis([0 5000 440 640]); grid on;
p. legend('PPG Signal','Peak-waves');
q. xlabel('Samples'); ylabel('Voltage(mV)')
r. title('Peak in PPG Signal')
Note: At this point the letter 'a' has been replaced by the minimum amplitude of the waves of the signal 'ppg' and the letter 'b' by the minimum distance between the maximum amplitude peaks of each wave.
Code 2
a. for i=1:d, x(i)=i;
b.seno(i)=sin(2*3.14*4/100*i)+sin(2*3.14*2/100*i)+sin(2*3.14*1/100*i)+sin(2*3.14*0.5/100*i ) + sin(2*3.14*0.25/100*i)+sin(2*3.14*0.125/100*i)+sin(2*3.14*0.0625/100*i)+sin(2*3.14*0.03 125/100*i);
c. end;
d. [waveseno,periodseno,scaleseno,coiseno,sig95seno]=wt(seno);
e. amplitudeseno=abs(waveseno);
f. for i=1:c mediaondasseno(i)=mean(amplitudeseno(i,1:d)); end
g. plot(mediaondasseno);
Note: At this point, the letter “d” represented the total number of points for analysis that were chosen in the original sign (on the abscissa axis of the original sign) and the letter “c” represented the number obtained by the equation.
Code 3
a. [waveppg,periodppg,scaleppg,coippg,sig95ppg]=wt(ppg);
b. [wave,period,scale,coi,sig95]=wt(ppg,'MakeFigure',1);
c. amplitudeppg=abs(waveppg);
d. for i=1:c mediaondasppg(i)=mean(amplitudeppg(i,1:d)); end
e. figure(2), plot(mediaondasppg).
References
1. Griffies, J. D., Zutty, J., Sarzen, M., & Soorholtz, S. (2018). Wearable sensor shown to specifically quantify pruritic behaviors in dogs. BMC Veterinary Research, 14(1), 1–10. https://doi.org/10.1186/s12917-018-1428-x.
2. Dorlas, J. C., & Nijboer, J. A. (1985). Photo-electric plethysmography as a monitoring device in anaesthesia. British Journal of Anaesthesia, 57, 524–530. https://doi.org/10.1093/bja/57.5.524.
3. Allen, J. (2007). Photoplethysmography and its application in clinical physiological measurement. Physiological Measurement, 28(3), R1–R39. https://doi.org/10.1088/0967-3334/28/3/R01.
4. Sahni, R. (2012). Noninvasive monitoring by photoplethysmography. Clinics in Perinatology, 39(3), 573–583. https://doi.org/10.1016/j.clp.2012.06.012.
5. Schultz-Ehrenburg, U., & Blazek, V. (2001). Value of quantitative photoplethysmography for functional vascular diagnostics: current status and prospects. Skin Pharmacology and Applied Skin Physiology, 14(5), 316–323. https://doi.org/10.1159/000056362.
6. Nilsson, L. M. (2013). Respiration signals from photoplethysmography. Anesthesia and Analgesia, 117(4), 859–865. https://doi.org/10.1213/ANE.0b013e31828098b2.
7. Leonard, P., Beattie, T., Addison, P. S., & Watson, J. N. (2003). Standard pulse oximeters can be used to monitor respiratory rate. Emergency Medicine Journal, 20, 524–525. https://doi.org/10.1136/emj.20.6.524.
8. Houston D. M. (2000). Clinical exam in dogs and cats. In O. M. Radostits, D. M. Houston, & I. G. Mayhew (Eds.), Veterinary Clinical Examination & Diagnosis (1st ed., pp. 98-101). W. B. Saunders Co. Ltd.
9. Silva, H., Roux, É., Gadeau, A. P., & Rodrigues, L. M. (2020). Wavelet analysis of microcirculatory flowmotion reveals cardiovascular regulatory mechanisms-data from a beta-blocker. Applied Sciences, 10(11), 4000. https://doi.org/10.3390/app10114000
10. Karlen, W., Garde, A., Myers, D., Scheffer, C., Ansermino, J. M., & Dumont, G. A. (2015). Estimation of respiratory rate from photoplethysmographic imaging videos compared to pulse oximetry. IEEE Journal of Biomedical and Health Informatics, 19(4), 1331–1338. https://doi.org/ 10.1109/JBHI.2015.2429746.
11. Nabutovsky, Y., Pavek, T., & Turcott, R. (2012). Chronic performance of a subcutaneous hemodynamic sensor. Pacing Clinical Electrophysiology, 35(8), 919–26. https://doi.org/10.1111/j.1540-8159.2012.034
